IPL 2020: What Do The Numbers Say?
- Shail Mirpuri
- Sep 4, 2020
- 10 min read
Updated: Sep 9, 2020

Source: RTHK News
With the 2020 Indian Premier League (IPL) season fast approaching, eager fans await some key battles between bat and ball that can define the entire tournament. In modern day cricket, especially in lucrative tournaments like the IPL, there are several hours put into analytics. In fact, almost every tactical decision made is the result of countless hours of data analysis occurring behind the scenes. From where to use the team's overseas quota to what bowling changes should be made in certain scenarios, analytics forms a key part of the sport today. As fans, we don't get to explicitly see the data behind the decisions made on the field. Being a cricket lover and analytics fanatic, I decided to delve deep into the numbers with the aim of deriving possible insights that may be used in the upcoming IPL season. This was done by analysing delivery and match level datasets spanning the entire IPL's existence (from 2008 to 2019). If you'd like a more in-depth look at how I carried out my analysis feel free to check out my code here!
The Top Players in IPL History
We will first begin with a look at the top 10 players, who have been awarded the most player of the matches (POTM) over the history of the IPL. I will consider how the journey of these players through the various seasons in the IPL.
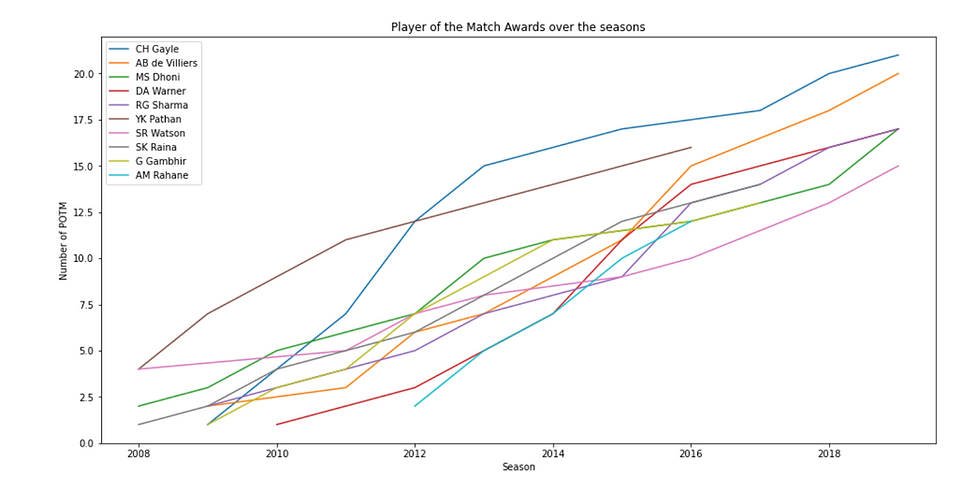
From the graph above, we can see that Chris Gayle leads the way in overall player of the matches earned. It seems that Gayle was his most prolific between 2010 to 2012, during when he propelled himself to first place and has been up there ever since. A close second to Gayle is one of the icons of the IPL and T20 cricket: AB De Villiers (ABD). ABD has steadily earned POTMs in every season of the IPL, which testifies to his incredible consistency, even while playing for a relatively unsuccessful Royal Challengers Bangalore (RCB) side. The most interesting take-away from this graph, however, is the meteoric rise of Yusuf Pathan during the early years of the IPL. Despite this, in recent times it seems that he has been struggling, with no POTMs earned since 2016. Yusuf Pathan is what, based on my cricketing knowledge, I would categorise as a 'hitter' or a 'finisher' so this may suggest that these types of players are not as important to the modern-day IPL as they were previously. Later, we will dive further into this by analysing our cluster model.
Batting and Bowling Combination Analysis
We will now move on to a more in-depth analysis of different batsman and bowler combinations throughout the IPL. First, we will consider which bowlers tend have an edge over a specific batters.
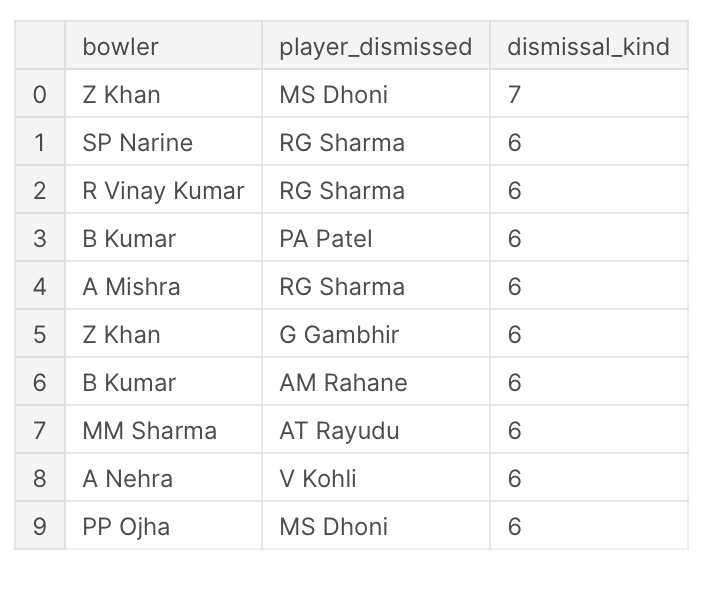
From the table above, we can see that MS Dhoni seems to have faltered to Zaheer Khan the most over the course of IPL history. Since Khan was a left arm swing bowler, this may be a potential weakness of MS Dhoni that can be exploited in the upcoming IPL season. We can analyse this even further by considering the type of dismissals for this combination. It seems that all 7 dismissals were the result of Ms Dhoni getting caught. This, again, can inform tactical decision making for teams that come up against Dhoni in this year's IPL. For instance, one potential tactic could be to bait Dhoni into playing an aggressive shot when he is up against a left-arm pace bowler.
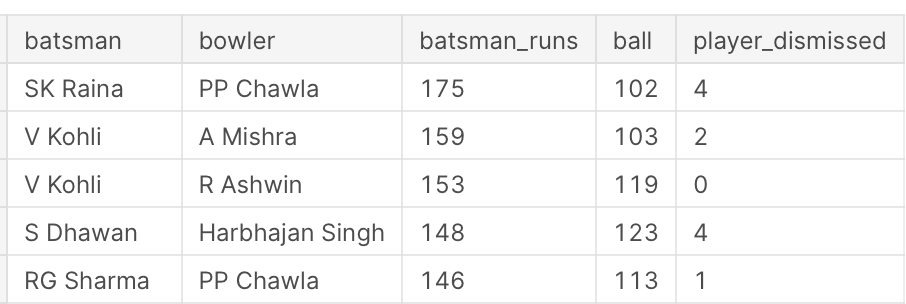
Another thing we can look at is the number of runs each batsmen has scored off a bowler. From this analysis, it seems that Virat Kohli has had an easy time when facing spinners such as Ashwin and Mishra. This insight may help to inform bowling choices when facing RCB (the team Kohli plays for).
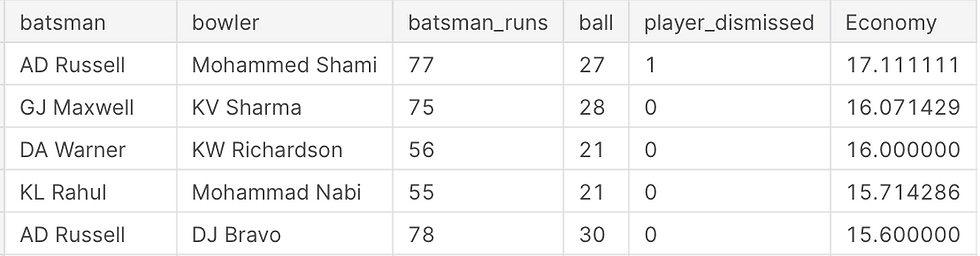
Apart from looking at statistics such as runs and wickets taken that may be influenced by the number of balls faced/bowled, we can also consider other, better measures of performance such as the Bowling Economy, Strike Rates and Averages between two players. An example of this can be seen in the table above, which takes an in-depth look at the economies of a bowler when bowling to a specific batter. We have only included combinations, where there has been at least 20 balls bowled by the bowler. Due to the law of large numbers, a small number of balls bowled can lead to extreme results in the economy that a bowler has. For instance if a bowler has only bowled a single ball to a particular batsmen and he was hit for a 6 then his economy would 36. This would lead to highly unreliable insights as these results are unlikely to be replicated in the long run.
We can see from the table above that Andre Russell seems to be creaming Shami all over the park. Therefore, with this insight, it would be highly unlikely that Shami will bowl to Russell the next time their teams face off.
Apart from analysing player-level trends, it would be more interesting to investigate the performance of different types of players such as Bowlers, Batsmen, Hitters, etc. Using this insight, teams could potentially make game-changing decisions about their squad selection and tactics. We will do by building a cluster model using features that are engineered and selected from our dataset.
Feature Engineering and Selection
In order for our cluster model to group the player data into more useful categories, we need to provide it additional features that are often indicative of a player's performance. Most of these features I have engineered myself using the data from our dataset. I will discuss in more depth my favourite features and the reasons behind why they are important to our model.
Percentage of Runs from Boundaries:
Firstly, I thought it would be interesting to analyse the percentage of each player's total runs that have come from boundaries. In cricket there are many different types of batsmen: Aggressive, Defensive, Moderate, etc. One way of distinguishing each type of batsmen is by considering how each get their runs. For example, aggressive batsmen are more likely to get their runs from boundaries in comparison to defensive ones. Thus, this feature allows our model to distinguish between these groups of batsmen, and will enhance our model's clustering capabilities.
Percentage of Overs in the Powerplay, Death and Middle
Similar to having different types of batsmen, in cricket we also have different types of bowlers that specialise in specific skills. For instance, we have swing bowlers that tend to open the bowling while the new ball is fresh and moving fast. On the other hand, there are specialist death bowlers such as JJ Bumrah, who tends to close out the innings with his exceptional ability of consistently bowling yorkers. By calculating the breakdown of overs bowled into power play overs (1-6), middle overs (7-15) and death overs (16-20), we can account for these different skills in our model.
Reciprocal of the Economy, Bowling Strike Rate and Bowling Average:
The economy, strike rate and averages of a bowler are key performance metrics that are commonly used in the cricket world to determine the quality of a bowler. The beauty of these measures is that they aren't dependent on experience, number of overs bowled or games played but rather they can be applied to any bowler to compare performances across different players.
One important thing to note is that I have chosen to use the reciprocal of the Economy, Bowling Strike Rate and Bowling Average as our measure since machine learning models tend to interpret higher numerical variables as better. In the game of cricket, a bowler aims to minimise these three metrics so this may lead to our model running into some diffculties. Additionally, if a player has never bowled or never taken a wicket, he will have an infinity value for this metric, and therefore our model won't be able to run using this value. Furthermore, analysing our cluster will be significantly easier if we know that for all our performance metrics the higher the metric, the better a player's performance. With all these considerations in mind, I decided to take the reciprocal of the Bowling Economy, Strike Rate and Average.
Summary of Features Selected
Batsmen Key Metrics
Runs
Batting Strike Rate
Batting Average
Percentage of Runs from Boundaries
Bowler Key Metrics
Wickets Taken
1/Economy
1/Bowling Strike Rate
1/Bowling Average
Extras
Percentage of Overs in the Powerplay, Death and Middle
Fielder/Wicket Keeper Metrics
Total Dismissals
Catches as percentage of total dismissals
Stumpings as percentage of total dismissals
Run outs as percentage of total dismissals
Additional Features
Whether or not a player has bowled in the history of the IPL
Cluster Model and the Key Features of Each Group
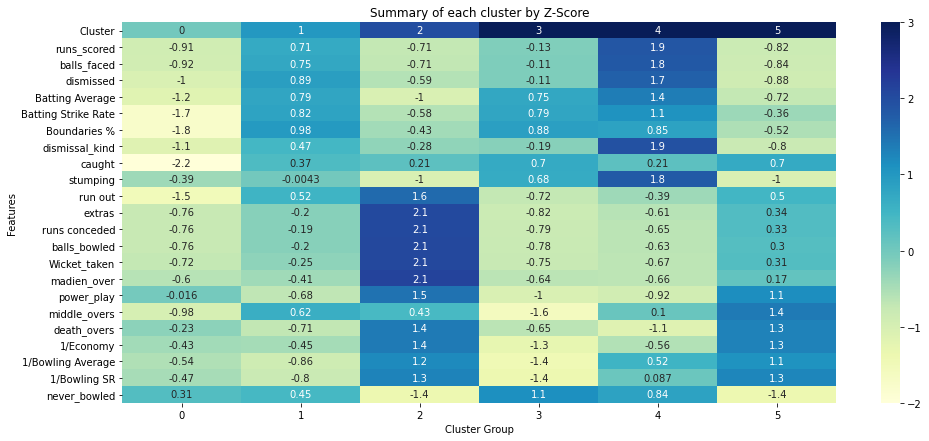
We clustered our player level data into 6 groups using the KMeans algorithm. In order to compare key features between each cluster, we will standardise these features using the Z-Score. The Z-Score for a given feature tells us how many standard deviations from the feature mean each cluster lies at. Using this we can easily distinguish the types of players in each cluster.
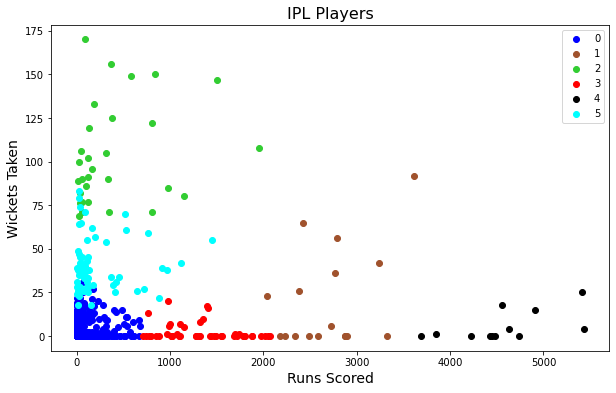
We can also easily distinguish whether a cluster is primarily made up of batsmen or bowlers by plotting a scatter plot of Runs Scored vs. Wickets Taken.
Summary of Each Group
Group 0: Low-Performing Players
Group 0 can be classified as the low performing group because as we can see from the scatter plot, it seems that players in the group have neither scored a lot of runs nor taken a lot of wickets. This is further reinforced by the heat map, which shows that the players in this group have lower than average performance metrics. This suggests that in fact these players are low performing rather than in-experienced since they have lower than the average Batting Strike Rates, Batting Averages, Bowling Averages, Bowling Strike Rates and Economy, which are metrics that are not reliant on the number of balls faced/bowled.
Group 1: Batting All Rounders/Hitters
Group 1 seems to be made up of aggressive hitters and batting all rounders. This is primarily because this group averages the greatest boundary percentages. I also think that this group is filled with batting all rounders because some of these players have taken more than 25 wickets throughout their IPL careers. Furthermore, we can also see that the overs bowled by these players tend to be in the middle of the innings and less so at the start or end. As an avid observer of the IPL, I tend to notice this to be the case for batting all rounders.
Group 2: 'Star'/Experienced Bowlers
Group 2 is clearly made up of relatively experienced 'star' bowlers. This can be infered through the high amount of wickets taken, balls bowled, and madien overs amongst other features. They also tend to bowl more in the powerplay and death overs, in which the pressure is really on.
Group 3: Mediocre Batsmen/ Wicketkeepers
Group 3 seems to represents mediocre batters that are quite inexperienced. This is because these batters tend to have faced lower than the average total balls, and have been dismissed lower than the average number of times. Despite this, their batting strike rates and batting averages are better than most other clusters, which suggests that these are batters who are either inexperienced or ordinary.
Group 4: 'Star' Batsmen/Wicketkeepers
Now we move on to the Star Batsmen: Group 4. This group seems consist of the elite batters throughout IPL history with names such as Virat Kohli and MS Dhoni making up a formidable force of players. We can see that players in group 4 are the cream of the crop when it comes to batting performance metrics with outstanding total runs scored, batting averages and strike rates. What's more is that these players tend to contribute the most in the field with the highest total dismissals.
Group 5: Inexperienced Bowlers
Last but not the least, we have group 5. Group 5 seems to consist of up-and-coming bowlers that are inexperienced in the IPL. This can be observed by the inferior total wickets taken in comparsion to the star bowler group. Despite this, group 5 seems to almost be matching the star bowler group in terms of bowling averages, bowling strike rates and economies.
Cluster Analysis
Now that we have categorised our player's into 6 different groups, we can carry out further analysis to see which types of players are the most important to a team in the IPL.
We will start by considering the number of POTMs earned each season by every cluster throughout the IPL.
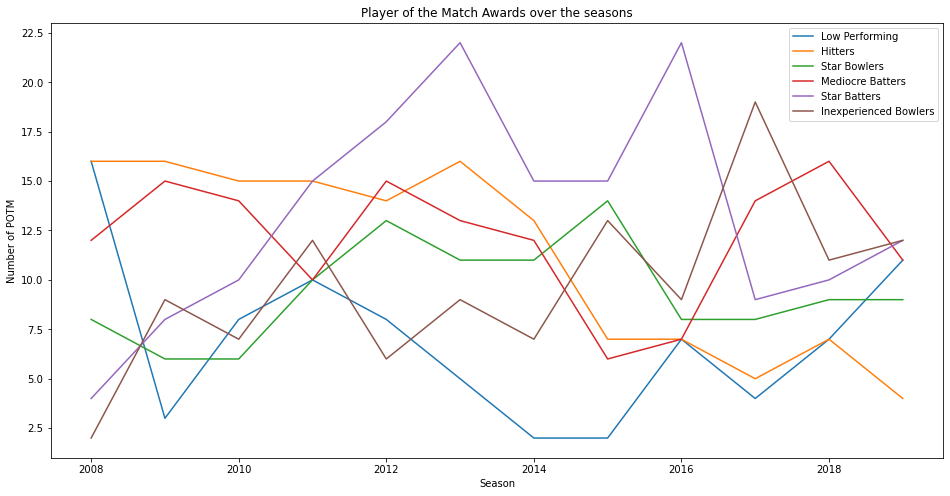
Firstly, in the graph above we can see that the 'low performing' cluster has been near the bottom of the pile in terms of season on season POTMs earned. Remember that we did not include the number of POTMs as a feature in our cluster model so this has not influenced the clustering of players. Therefore, this reinforces our interpretation that group 0 is indeed the cluster made up of low-performing players. Another interesting observation is that in almost every season 'star' batters have outshune 'star' bowlers in terms of total POTMs earned. This suggests that the quality of batsmen is more important to the team than the quality of bowlers. In fact, what's even more fascinating is the surge of 'inexperienced' bowlers up the POTM's charts over time. This suggests that inexperienced bowlers are becoming a greater part of the game. This may be because their 'inexperience' actually provides them with a sense of mystery against batsmen. One such player in this group is the young leg-spinner Rashid Khan, who has taken the IPL by storm over the recent seasons with even the most established batters struggling to pick his variations.
Another interesting thing to pick out is the steady decline of POTMs received by 'hitters' in the IPL over time. This suggests that these players are not as effective or significant to a match as they once were during the inception of the IPL. We have seen this earlier with Yusuf Pathan's sharp decline over the last 5-6 seasons.
Apart from analysing the breakdown of POTMs by cluster, we can also consider the types of players that make up of unsuccessful and successful squads in the IPL. We will first do this by looking at the breakdown of the most-successful team in terms of championships won, and the winners of last season's IPL: The Mumbai Indians (MI).
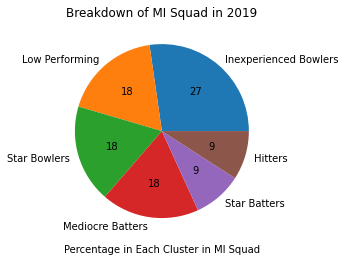
We can see from the piechart above that the Mumbai Indian's 2019 team was largely made up of inexperienced bowlers. This again stands testament to what we saw earlier that the quality and experience of bowlers seems to not have a significant impact on a team's performance. Let's now compare this with the breakdown of the rock bottom team in 2019: Royal Challengers Bangalore (RCB).
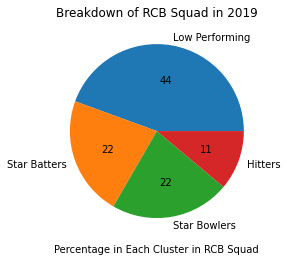
From the chart above, it is clear that group 0 represents the low performing players in the IPL. This is because, alongside our earlier analysis, the team that performed the worst in 2019 tended to be made up largely of players from the group 0 cluster. This reinforces our previous interpretations and analysis.
Key Insights
We taken a deep-dive into the numbers of the most popular T-20 cricket league in the world to derive some invaluable insights. Through our cluster analysis we have seen that the experience level of bowlers in the IPL doesn't seem to play a big role in predicting whether or not they perform well for their team. This can be seen specifically through the rapid rise in inexperienced bowlers, with these players earning more POTMs throughout the seasons. On the other hand for batsmen, it seems that prior experience and quality plays a major role in performance with the 'star' batters earning significantly more POTMs season-on-season than mediocre batsmen. This suggests that it may be smarter for teams to use their overseas selection quotas primarily on batsmen since these overseas players tend to have more experience and be of a greater quality. Using this strategy, teams can then employ younger, hungrier local bowlers in their lineup instead of wasting their overseas quota on their bowling lineup.
The power of numbers in cricket should not be underestimated. An exploration of the data can aid teams to derive countless valuable insights, which can be the difference between a win and a loss. These insights can inform which bowlers should bowl to which batsmen, fielding strategies to get key players out, and squad selection. We will undoubtedly see the impact of these numbers, whether implicitly or explicitly, as the upcoming season progresses.
References

Comments